Why you will love Centenary University
We welcome you to Centenary University, going beyond the traditional, for an educational experience that is innovative, open, and fast moving, offering relevant and practical learning that is responsive to your needs today and the workplaces of the future.
Mission
Centenary University delivers accredited degree programs and other dynamic learning experiences to prepare students for regional and global professions of critical thought and purposeful action within a supportive environment immersed in a culture of service.
Focus
To develop students emotionally, intellectually and interculturally.
Vision
To be the intellectual, economic, & cultural Heart of the Skylands region.
Personalized teaching that fits the way you learn best
Centenary University is a private NJ university that cares for the whole person as your educational resource for the start of your career, and then as you thrive through life.
You’ll go beyond traditional academics to satisfy your intellectual curiosity, gain intercultural competence, and strengthen emotional resilience. You’ll learn in a caring environment where you will feel secure. Centenary programs adapt to give you a personalized experience that supports you reaching your true potential.
With traditional, online, evening and accelerated courses, you have the flexibility to build your studies around your life as an on campus resident, commuter, or adult with a family and a job.
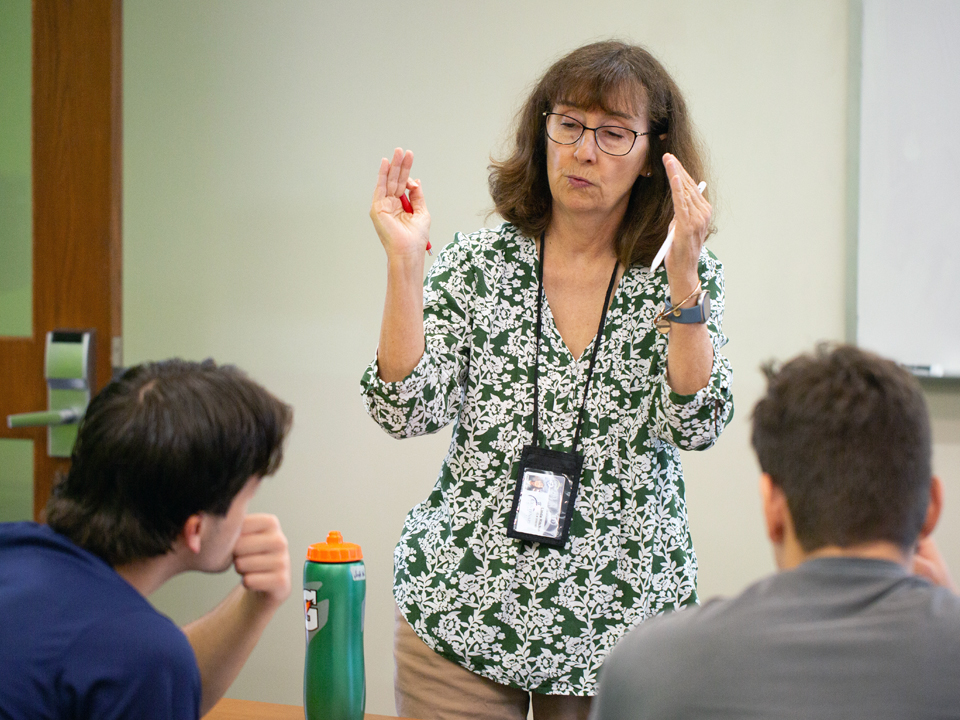
You will learn in a collaborative environment, with a 12 to 1 student-to-faculty ratio, where professors take the time to get to know you and you have the opportunity to explore beyond the classroom. Individualized attention and academic support, including for those who are neurodivergent or need physical accommodations, ensure success.
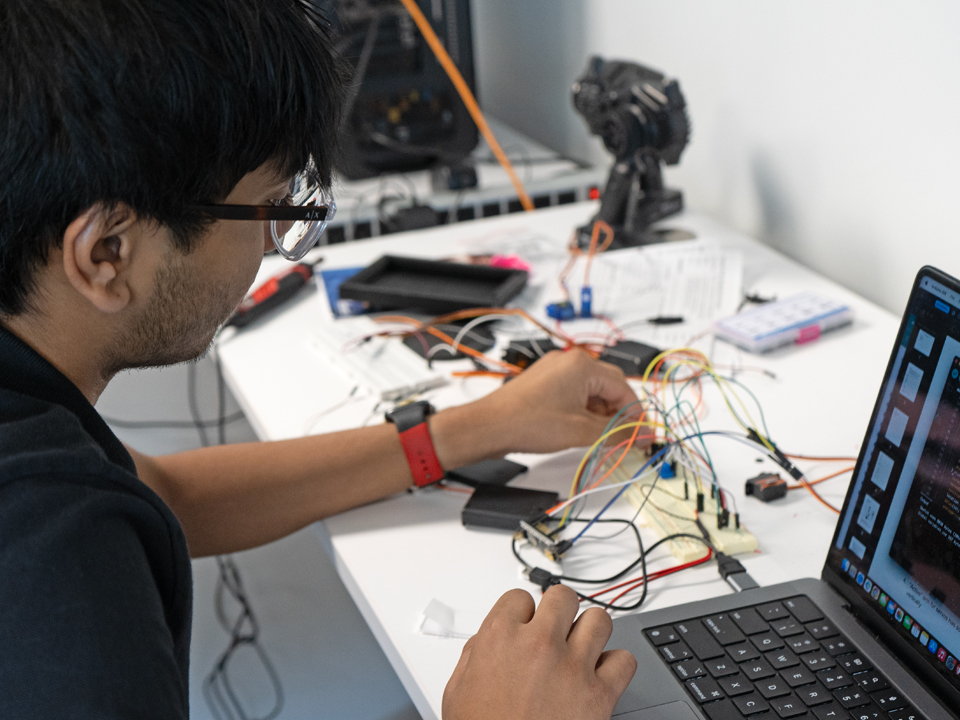
Innovative programs transforming the university experience
We are innovating a variety of teaching approaches and partnerships for practical learning that fit the way you learn. In today’s fast-moving world, expertise is perishable. That is why we design programs that evolve to meet your needs, now and throughout your life.
Breaking barriers and changing lives
A high-profile example of innovation at Centenary is our Ideal Institute partnership in Southern New Jersey. Students can earn a living while earning a degree.
Your resource for life-long learning
Defining who is a student is broad for those coming to Centenary, not limited by age or circumstances. You may be a high school senior seeking a traditional four-year degree. You may be a craftsman seeking to learn how to successfully start a business. You may be a rising executive needing to learn a new skill or add a credential. Or you may simply want to explore an area of personal interest. On campus, online, and blend of both, we meet you where you are.
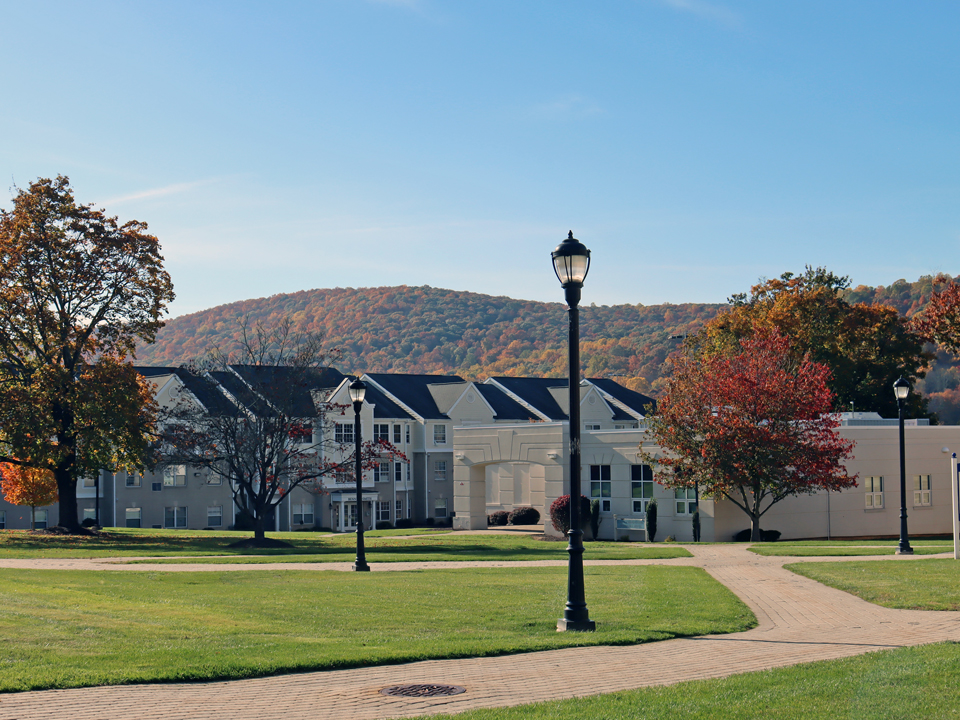
Safely nestled in the hills of New Jersey
Our beautiful campus is in historic Hackettstown, just a few hours drive from New York City or Philadelphia, but is worlds away when it comes to natural beauty, safety, and a distraction-free environment and university experience.
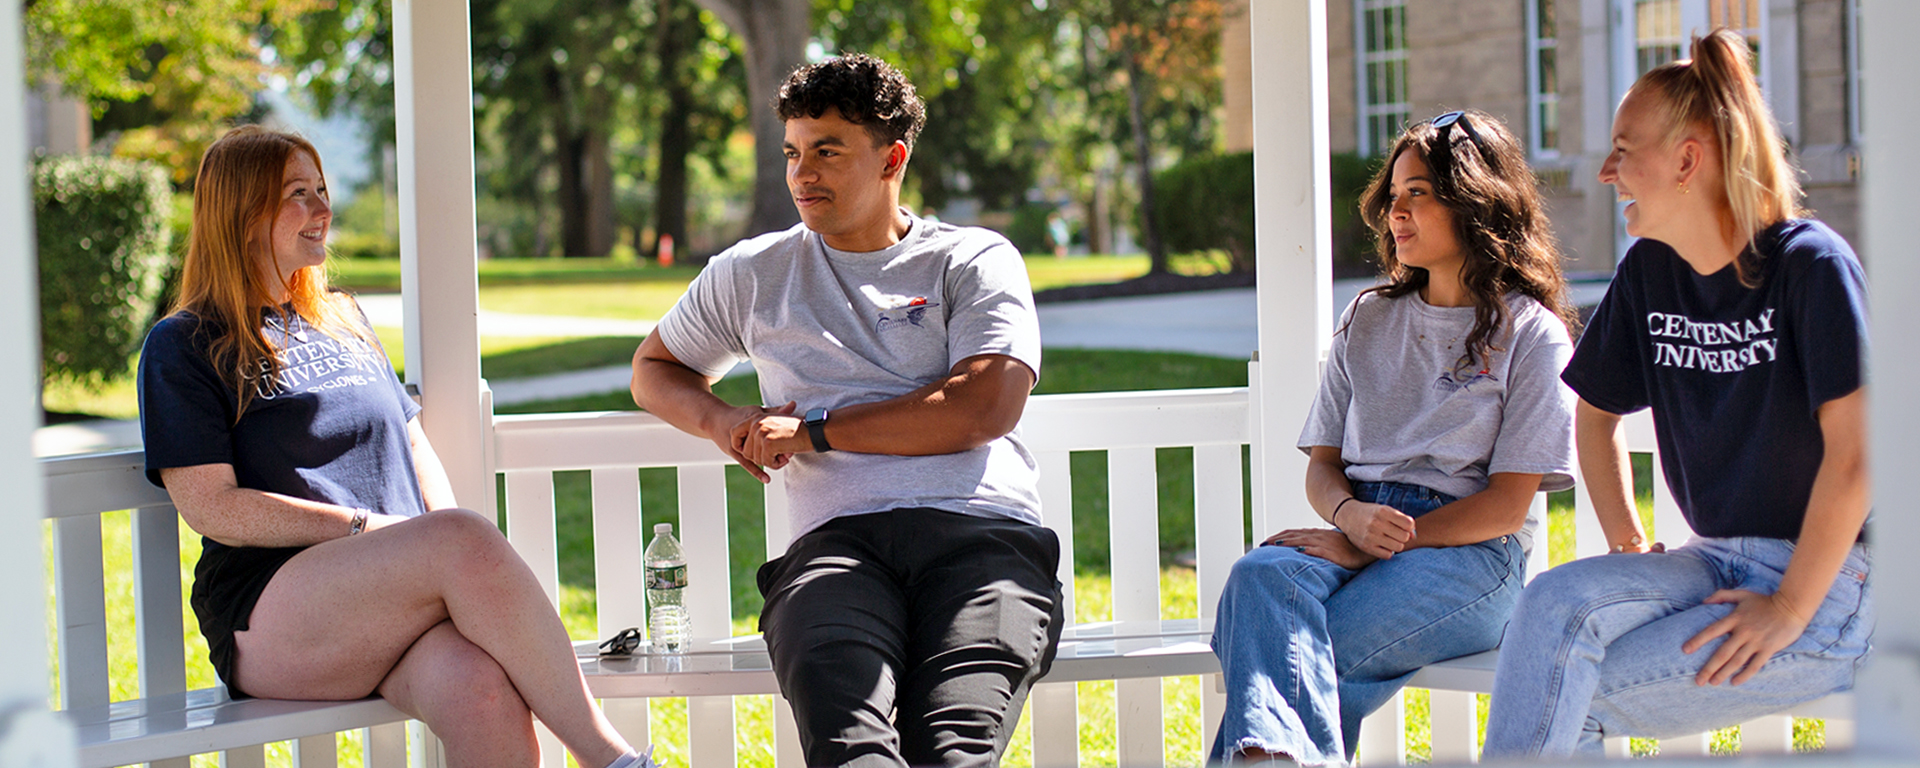
Students enjoy a home-like campus life, without the hustle and bustle of big city universities or the crime that too often is part of the university experience. You’ll be able to concentrate on your studies and form tight friendships with peers and professors.
Here you are surrounded by serene mountain views, a charming and walkable town, and plenty of opportunities to bike the mountains, kayak the Delaware River, or enjoy a horseback ride through spectacular fall color.