Why you will love Centenary University
We welcome you to Centenary University, going beyond the traditional, for an educational experience that is innovative, open, and fast moving, offering relevant and practical learning that is responsive to your needs today and the workplaces of the future.
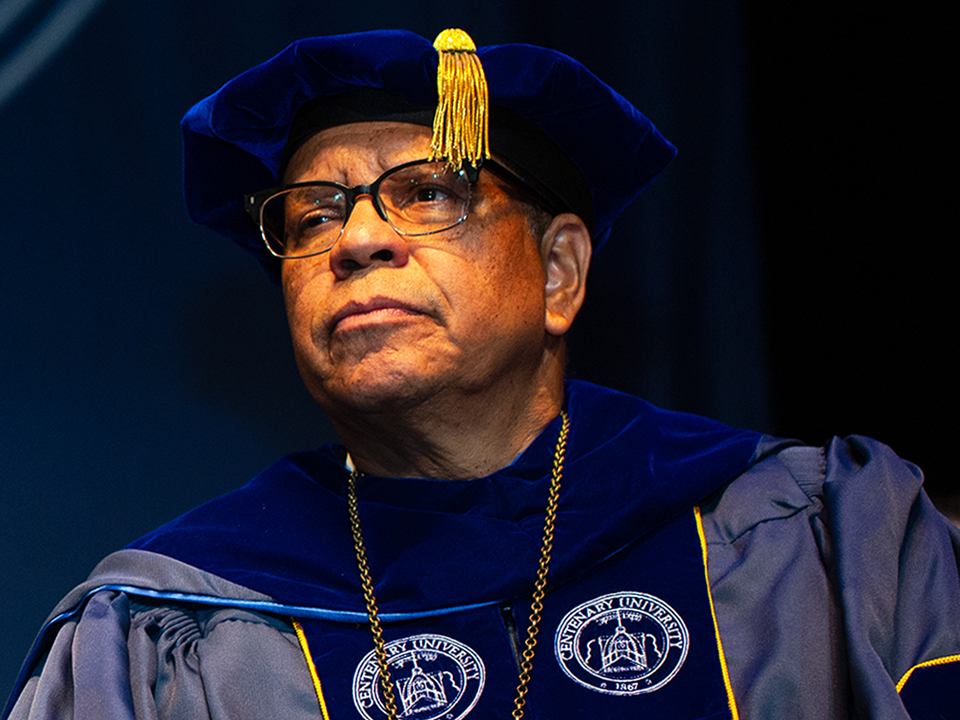
A Message from President Dale Caldwell
I had the tremendous honor of being named the 15th President of Centenary University in February. Since that time, I have met with many students, faculty, staff, parents, alumni and community members and have been very impressed with the universal love and respect people have for the university.
It is clear that since its founding in 1867, Centenary has focused on providing students with the intellectual, emotional and physical well-being that they need to excel after graduation. Over many discussions, I became convinced that our education focus should be on helping our students develop the five most important tools to help them succeed in life after graduation. These are:
- Intellectual curiosity
- Strong analytical skills
- Emotional resilience
- Intercultural competence
- Commitment to community service
Mission
Centenary University delivers accredited degree programs and other dynamic learning experiences to prepare students for regional and global professions of critical thought and purposeful action within a supportive environment immersed in a culture of service.
Focus
To develop students emotionally, intellectually and interculturally.
Vision
To be the intellectual, economic, & cultural Heart of the Skylands region.
Since its founding, the university has been helping students develop in these five areas. However, during my tenure as President, I hope that we can be more intentional and innovative in customizing our education so students excel in these areas and live their best life after graduation.
It is hard to express in words how excited I am to have been chosen as the President of Centenary University. It will be an honor to work in partnership with the Board of Trustees, faculty, staff, students, alumni and community members to advance the university’s vision and mission in new and innovative ways. My terminal degree, leadership accomplishments and higher education experience have prepared me to lead Centenary at this critical point in its history.
As the Executive Director of the Fairleigh Dickinson University (FDU) Rothman Institute of Innovation and Entrepreneurship, I helped to make the Institute the most influential higher education entrepreneurial organization in New Jersey, serving family businesses, veteran entrepreneurs and urban enterprises. This work led to the great honor of being named one of the 50 Most Influential People in Higher Education and one of the 50 Most Influential People of Color in both the NJBiz and ROI-NJ magazines.
As President of the Educational Services Commission of New Jersey (ESCNJ), where I was re-elected every year for 22 years, I played a leadership role in developing the organization’s strategic vision and recommending operational initiatives resulting in a 400% increase in revenue from tuition, special programs and contributions totaling $164M.
I’ve been recognized by the President of FDU for my leadership and commitment to diversity, where my leadership role as Chair for the FDU Diversity, Equity and Inclusion (DEI) Advisory Council helped secure a $1.5M grant from the State for training and sensitivity analysis. I anticipate using my business experience, contacts and insights to engage government, business, philanthropic, academic and other leaders to secure critical partnerships and financial support for Centenary University.
Academic institutions across the country are facing enrollment challenges fueled by labor shortages and other economic and demographic changes. The shrinking pool of eligible college-age students in the United States will force institutions of higher education to provide better offers and dynamic new programs while recruiting international students and exploring alternative revenue sources. I am very excited to work with the Centenary family and friends to tackle current higher education financial challenges and achieve record levels of success by leveraging our unique offerings and partnerships. Please join me in making Centenary one of the leading universities providing an innovative well-rounded education for our students.
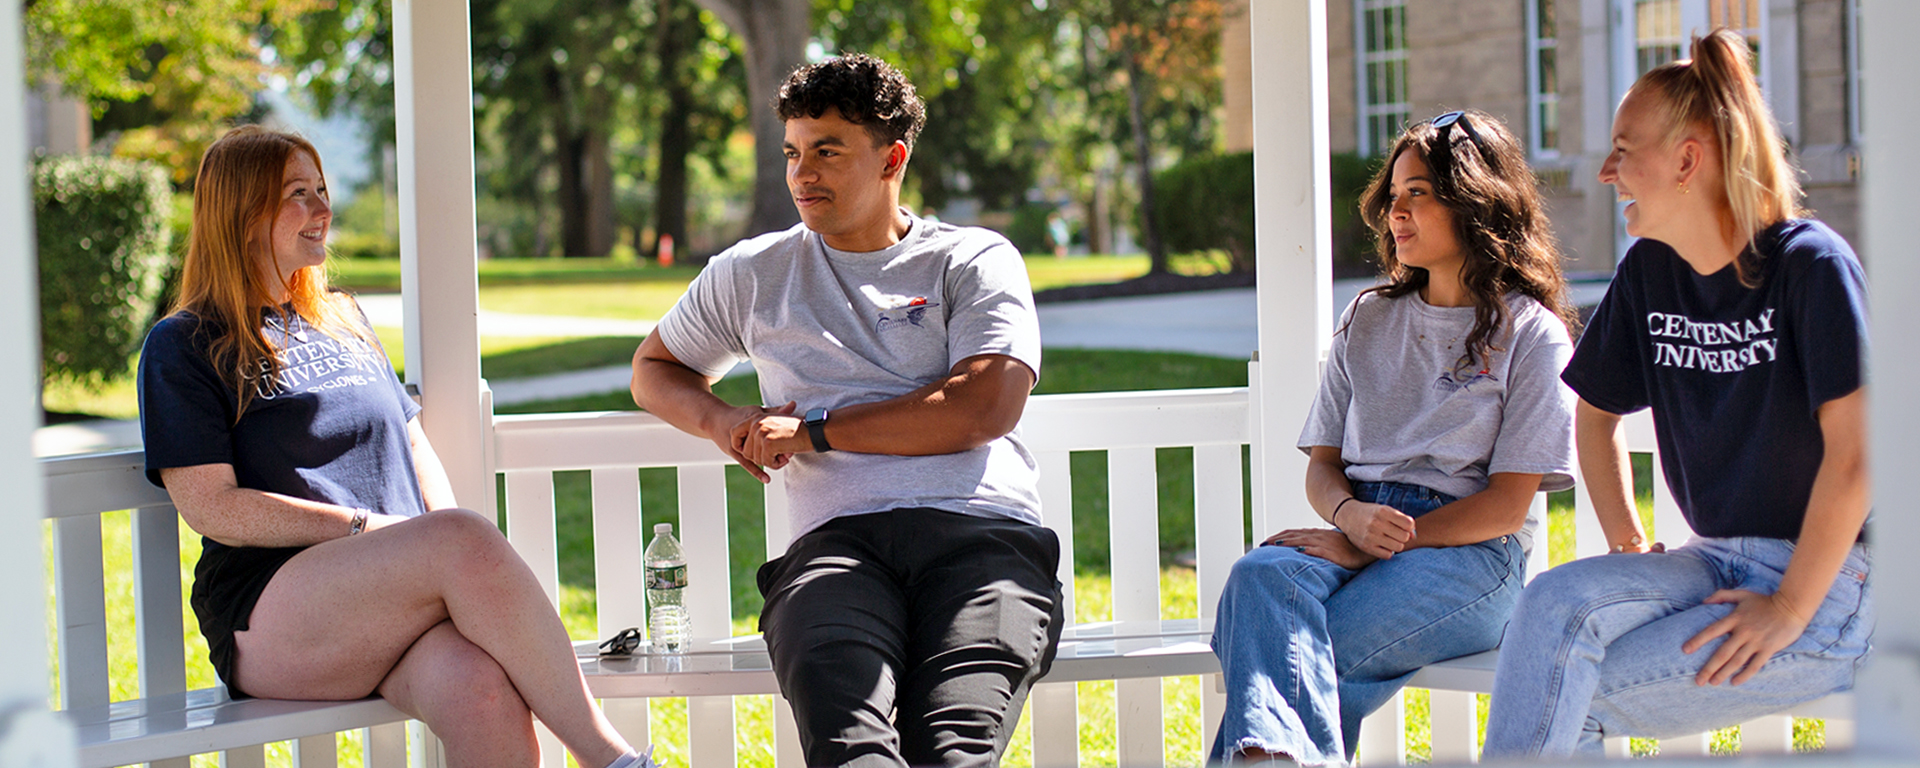
Personalized teaching that fits the way you learn best
Centenary University is a private NJ university that cares for the whole person as your educational resource for the start of your career, and then as you thrive through life.
You’ll go beyond traditional academics to satisfy your intellectual curiosity, gain intercultural competence, and strengthen emotional resilience. You’ll learn in a caring environment where you will feel secure. Centenary programs adapt to give you a personalized experience that supports you reaching your true potential.
With traditional, online, evening and accelerated courses, you have the flexibility to build your studies around your life as an on campus resident, commuter, or adult with a family and a job.
You will learn in a collaborative environment, with a 12 to 1 student-to-faculty ratio, where professors take the time to get to know you and you have the opportunity to explore beyond the classroom. Individualized attention and academic support, including for those who are neurodivergent or need physical accommodations, ensure success.
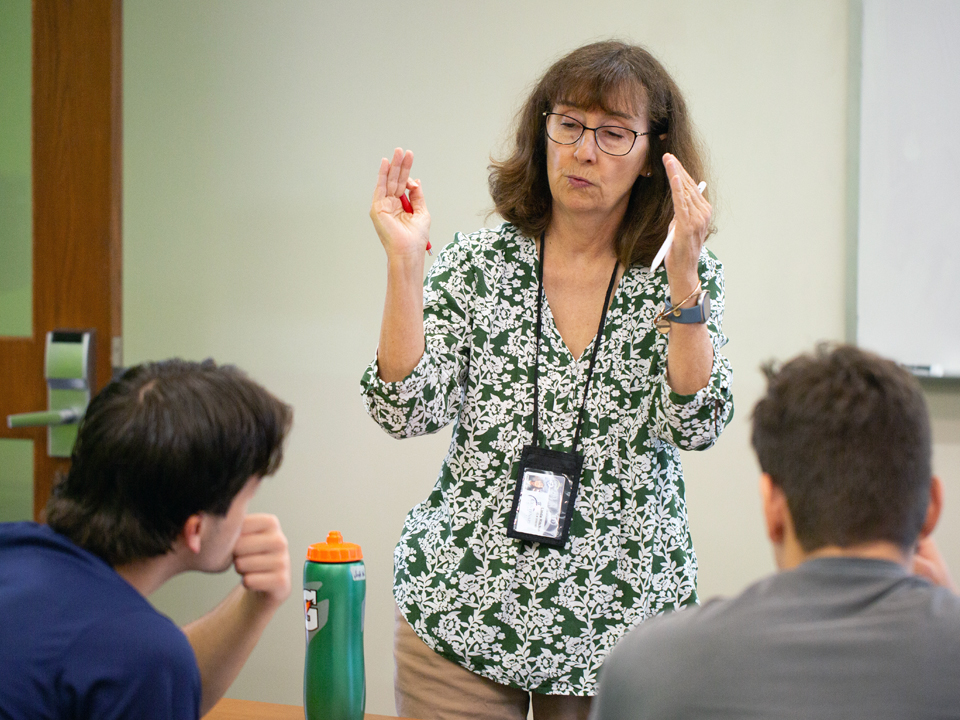
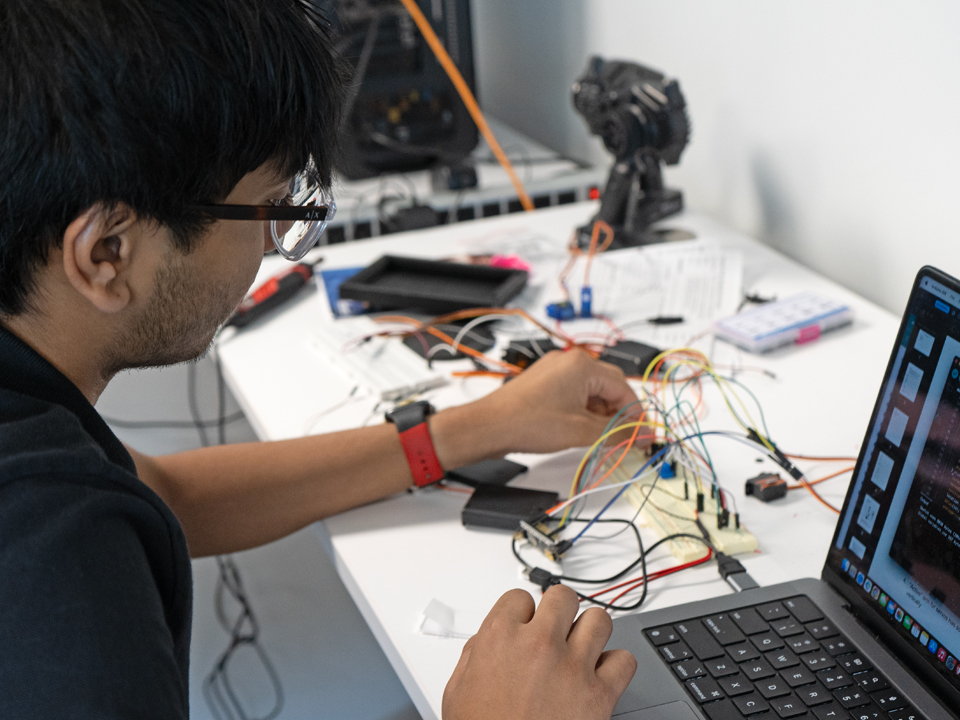
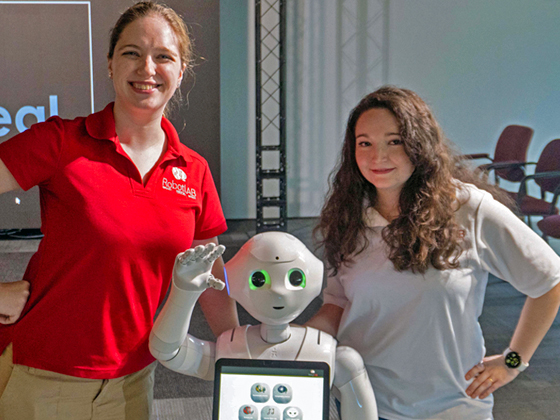
Innovative programs transforming the university experience
We are innovating a variety of teaching approaches and partnerships for practical learning that fit the way you learn. In today’s fast-moving world, expertise is perishable. That is why we design programs that evolve to meet your needs, now and throughout your life.
Breaking barriers and changing lives
A high-profile example of innovation at Centenary is our Ideal Institute partnership in Southern New Jersey. Students can earn a living while earning a degree.
Your resource for life-long learning
Defining who is a student is broad for those coming to Centenary, not limited by age or circumstances. You may be a high school senior seeking a traditional four-year degree. You may be a craftsman seeking to learn how to successfully start a business. You may be a rising executive needing to learn a new skill or add a credential. Or you may simply want to explore an area of personal interest. On campus, online, and blend of both, we meet you where you are.
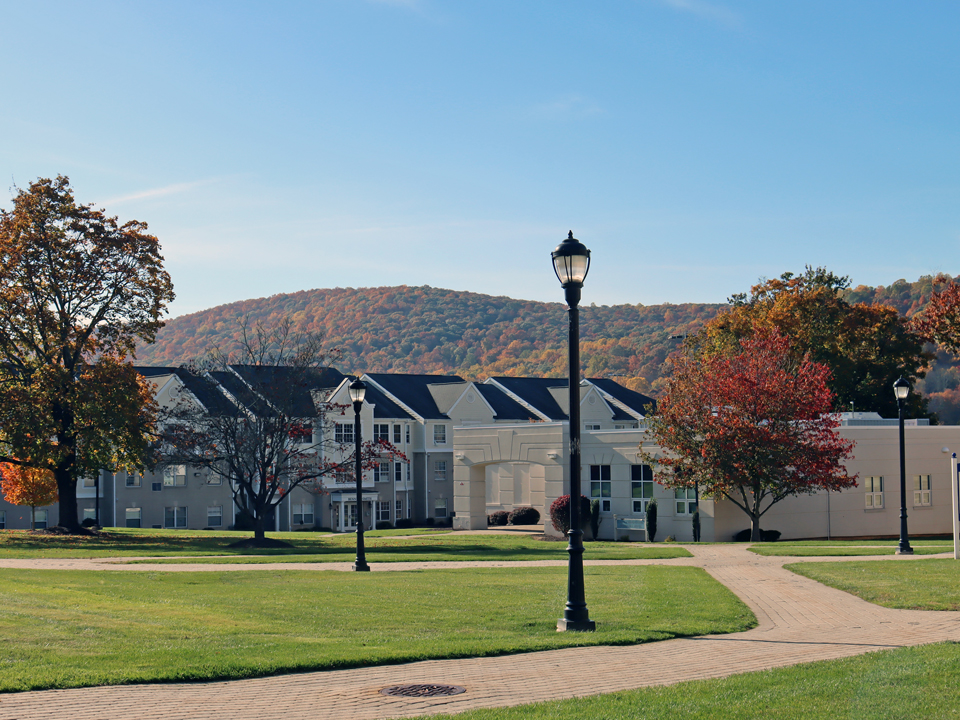
Safely nestled in the hills of New Jersey
Our beautiful campus is in historic Hackettstown, just a few hours drive from New York City or Philadelphia, but is worlds away when it comes to natural beauty, safety, and a distraction-free environment and university experience.
Students enjoy a home-like campus life, without the hustle and bustle of big city universities or the crime that too often is part of the university experience. You’ll be able to concentrate on your studies and form tight friendships with peers and professors.
Here you are surrounded by serene mountain views, a charming and walkable town, and plenty of opportunities to bike the mountains, kayak the Delaware River, or enjoy a horseback ride through spectacular fall color.